

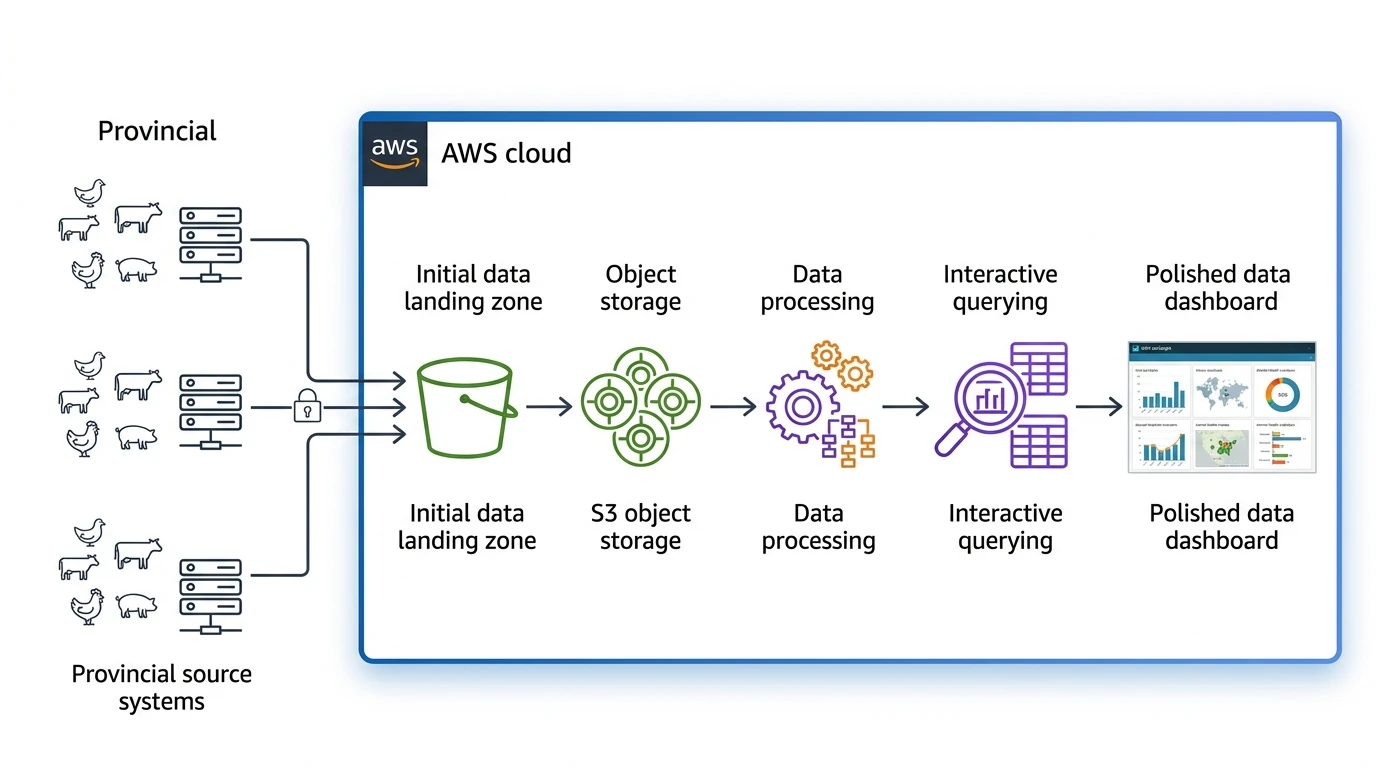
CAHSS is a Canadian collaborative network that monitors animal health trends using laboratory and abattoir data gathered across multiple provinces. CAHSS needed a unified, scalable way to collect, transform, and visualize animal health surveillance data from multiple provinces. ASCENDING helped CAHSS build an AWS-based data and analytics platform that turns laboratory and abattoir data into intuitive dashboards for faster surveillance insight.
BackgroundA Multi-Province Data Collection Initiative Since 2020
CAHSS is a public-sector surveillance program that depends on consistent, multi-year data-sharing agreements with provincial partners to track animal health trends. Since January 2020, CAHSS has worked with partners to explore how data collected for other purposes could be used to generate animal health surveillance information.
CAHSS had agreements with multiple provinces in Canada to collect, clean, and store abattoir and laboratory data valuable for surveillance. The data arrived on different schedules, including monthly, weekly, and daily uploads. CAHSS needed a solution that could unify the data and make it useful for animal health surveillance teams.
The goal was not only to centralize the data in a cloud data lake and analytics platform, but to help surveillance teams identify patterns and trends more quickly through secure, intuitive visualization.
The ChallengeUnifying Fragmented Provincial Surveillance Data
The challenge is unifying fragmented, multi-province laboratory and abattoir data into one secure, scalable surveillance platform. CAHSS wanted to build a data system that could collect laboratory and abattoir data from provinces such as Alberta, Manitoba, and Saskatchewan.
The new platform needed to be:
- Cost-effective enough for long-term operation.
- Secure enough to protect sensitive animal health surveillance data.
- Scalable enough to ingest data from multiple provincial sources.
- Flexible enough to transform raw data into a consumable analytics format.
- Easy enough for domain experts to explore trends without relying on manual spreadsheet analysis.
Traditional formats such as text reports and spreadsheets made it difficult and time-consuming to monitor disease patterns or other animal health trends across large datasets. Many analytics use cases also depended heavily on one or two key staff members' domain expertise, which made knowledge transfer and analytics scaling difficult.
Why ASCENDINGAWS Glue and QuickSight Delivery Expertise
ASCENDING is CAHSS's long-term AWS consulting partner for combined data engineering and visualization delivery. ASCENDING was selected because the project required both automated data engineering and advanced visualization capabilities.
ASCENDING brought experience as an AWS Advanced Tier Services Partner with data and analytics expertise, including AWS Glue and Amazon QuickSight delivery experience. The team had demonstrated similar hands-on delivery experience and became CAHSS's long-term consulting partner for the data platform.
The SolutionA Secure AWS Data Pipeline for Surveillance Analytics
The solution is a secure AWS data pipeline that ingests, catalogs, queries, and visualizes surveillance data end-to-end. ASCENDING data engineers worked closely with CAHSS to document existing surveillance use cases and design QuickSight dashboards around them.
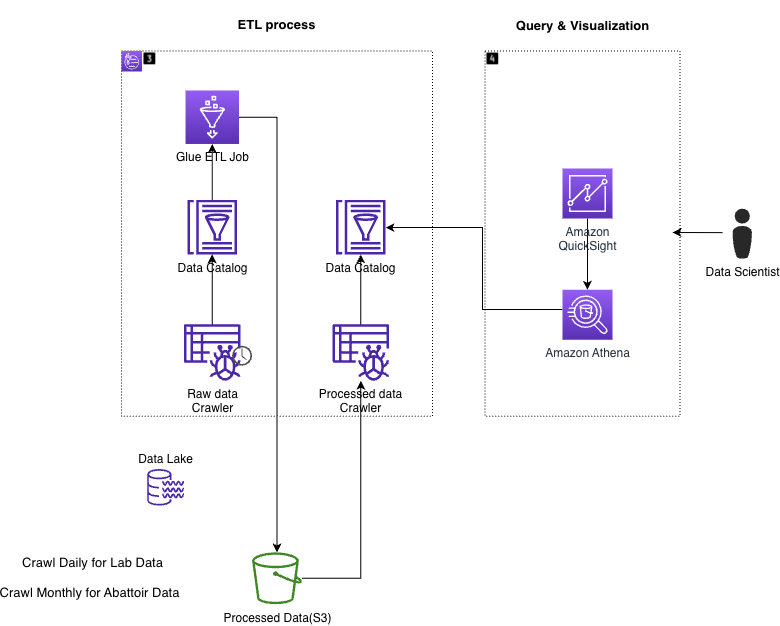
The platform uses AWS services to ingest, catalog, query, and visualize surveillance data:
- Raw laboratory and abattoir data lands in Amazon S3.
- AWS Glue crawlers and ETL jobs process and catalog the data.
- Amazon Athena queries the processed datasets.
- Amazon QuickSight renders dashboards and charts for surveillance teams.
- Embedded analytics can be integrated into the CAHSS main site with authentication and authorization controls.
This architecture allows processed data to be automatically retrieved by QuickSight through Athena queries from S3, giving CAHSS a secure and scalable analytics layer for surveillance use cases.
The OutcomeFaster, More Accessible Animal Health Insights
The outcome is faster, more accessible surveillance insight delivered through automated Amazon QuickSight dashboards instead of manual spreadsheet review. CAHSS reduced its dependency on manual knowledge transfer for animal surveillance use cases because those use cases were automated into data visualization charts.
The dashboards help users reduce the time required to read and analyze data, allowing them to observe changes and trends more intuitively. Surveillance trends are updated near real-time, helping CAHSS teams engage with the data more actively.
Key outcomes included:
- Automated visualization of animal surveillance use cases.
- Faster data interpretation compared with spreadsheet-based review.
- More intuitive trend analysis across large surveillance datasets.
- Reduced dependency on individual staff knowledge for recurring analytics use cases.
- A scalable AWS foundation for future surveillance data sources and dashboards.
Built with AWS Data and Analytics Services
Frequently Asked Questions
How long does it take to onboard a new province into the CAHSS surveillance platform?
Timeline is typically a phased onboarding: mapping the new province's data formats and upload schedule, extending the AWS Glue crawlers and ETL jobs to cover the new source, then validating the resulting QuickSight dashboards before surveillance teams rely on them.
How is sensitive animal health data protected when dashboards are embedded on the CAHSS website?
Security is enforced through authentication and authorization controls on the embedded analytics layer, so only verified users can view QuickSight dashboards, while the underlying laboratory and abattoir data stays governed inside the AWS environment rather than being exposed directly.
Does the platform stay cost-effective as more provinces and data sources are added?
Cost stays predictable because services such as Amazon Athena charge per query rather than for idle infrastructure, so CAHSS pays for analytics capacity in line with actual surveillance workloads instead of provisioning servers for peak, multi-province demand.